The mystery of load average spikes
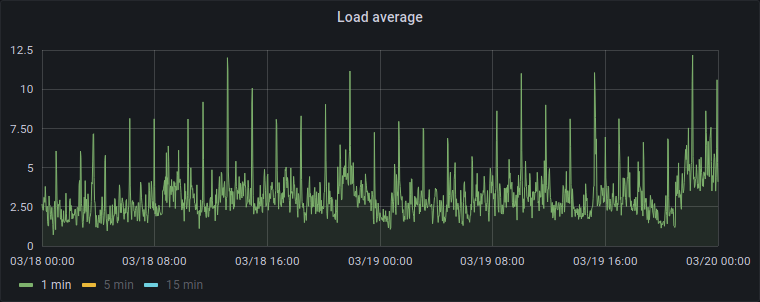
A while ago, we discovered a KDE server had strange and perfectly periodic spikes in system load average. Every 1 hour 45 minutes like clockwork, the load average would double or triple very briefly.

This caused some actual practical problems.
For example, anonsvn.kde.org is configured
to block new connections if the load average is too high.
These spikes made anonsvn refuse connections,
which more than once occurred while a release was being created,
which caused missing languages in the release
because the release script couldn't get translations from anonsvn...
We couldn't figure out what was causing these increases in load average.
I waited for when the peak was "due" to happen,
looked at top in the server,
and nothing seemed out of the ordinary.
There was no increased CPU that matched those peaks.
We looked at disk I/O, network activity,
interrupts, context switches, running processes...
nothing seemed to have a correlation to the load average peaks.
None of those metrics had noticeable changes
that matched the 1h45m frequency.
So what could possibly be causing this? We even suspected a kernel bug or a hardware problem.
Looking at historical metrics
Many KDE servers are actually LXC containers sharing a physical server. Unlike Docker, which is designed for individual applications, these containers run a full Linux distro, init system, etc. We basically treat them like VMs with less overhead. In this case, we have a physical server called Ctenzi, which has two LXC containers: Leptone (hosting KDE Invent / GitLab) and Gallien (hosting MyKDE). We run Telegraf, the agent collecting system metrics, on both the host system and inside each container.
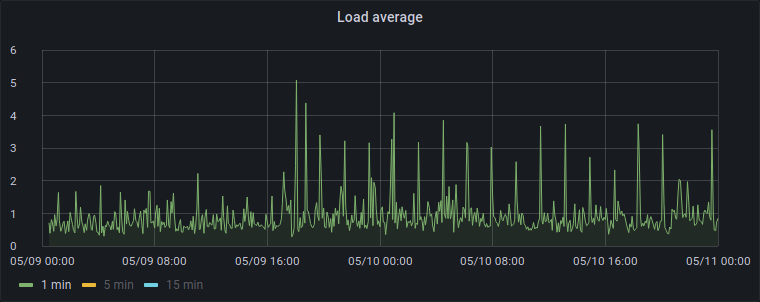
I looked at the oldest historical metrics we had for leptone to see if this problem has always been happening. It turned out that back then we weren't running Telegraf on all servers, we were installing it "as needed", so unfortunately we didn't have metrics from the very beginning of leptone's life. But I found something interesting:
- 2020-05-09 00:30: I installed Telegraf on leptone, so that's where the graphs start for leptone.
- 2020-05-09 17:30: I finally made the change to install Telegraf on every server (including the host ctenzi and the other container gallien).
And the metrics we have before 17:30 don't seem to show those peaks:

So... Telegraf is somehow eating CPU on the other two systems? Or they're somehow interferring with each other?
I tried stopping Telegraf on ctenzi and gallien... and it didn't seem to change anything:
[17:57] <nicolas17> the stats we have for leptone between those two times don't appear to have load peaks...
[17:57] <nicolas17> is telegraf on ctenzi/gallien causing this?!
[17:59] <nicolas17> I will do a test on the next "scheduled" peak
[17:59] <nicolas17> in about an hour
[18:21] <bcooksley> How could telegraf cause it?
[18:21] <bcooksley> That makes no sense...
[18:22] <bcooksley> Surely our other servers would be having the same issue in that case
[18:22] <bcooksley> Especially Hersili which is a near identical setup
[18:22] <bcooksley> With Deino and Telemid
[18:22] <bcooksley> It has NVMe storage and spinning rust
[18:23] <bcooksley> Only difference is 1TB vs. 512GB NVMe and maybe the CPU?
[18:23] <bcooksley> Ctenzi might be Intel vs. Hersili likely being Ryzen?
[18:26] <nicolas17> I have no idea why it could be
[18:27] <nicolas17> I will stop it on ctenzi and gallien and see if leptone gets a peak again

[19:06] <nicolas17> just stopped telegraf on ctenzi and gallien
[19:12] <nicolas17> and just got the peak in leptone's graphs
[19:12] <nicolas17> so that was not it
[19:16] <bcooksley> So it didn't happen for 17 hours, and then started happening
[19:17] <bcooksley> Yet the thing that changed at the time... Isn't the cause apparently
We did some other tests (like shutting down GitLab to see if that was the cause) and they also didn't seem to make any difference.
Other servers too
Later we discovered that other physical servers were actually having the same problem, we just hadn't noticed, in some cases because the peaks weren't as high, or because load average from normal activity was more "noisy". Load average peaks on other servers were at the exact same frequency (1h45m), but not on all servers simultaneously.
I tried to overlay lines at the right frequency on top of the graph to see if they happened when "expected" and found it was closer to 1h44m (104 minutes). This was getting more mysterious because the other affected servers had different hardware and different kernel versions.
I still suspected Telegraf could have something to do. So I did what I should have done before.
I Googled "telegraf 104 minutes".
Drifting timers
And sure enough, this did happen to other people. I found issues reported on the Telegraf repository on GitHub titled CPU load due to Telegraf agent (mentioning the 104m interval) and high load average every 1h 45m.

Following some links from there, I found a blog post from Avast where they had a similar problem, with a different metrics-collection agent (collectd), and at a different interval between spikes (~7 hours), but ultimately the same cause.
Apparently what happens is: every 5 seconds, Telegraf polls lots of system metrics simultaneously, using a dozen separate threads. Every 5.004 seconds, the kernel counts how many threads are runnable or blocked and calculates the load average based on that. And every ~104 minutes, those two timers line up exactly, before drifting again.
When the timers line up, at the exact moment the kernel calculates the load average, it sees Telegraf has a dozen running/runnable threads at the same time, and adjusts the load average upwards accordingly. The sudden increase in running threads is very brief, which is why we don't see an increase in CPU usage, but every 104 minutes, the load average calculation catches precisely at the right time.
Where does the "104 minutes" number come from?
The kernel calculates load average every 5 seconds plus 1 kernel tick
(Linux has an HZ setting with the tick frequency).
In the Avast blog post,
they mention they have load average spikes every ~7 hours.
In their CentOS systems, HZ=1000,
so that's every 5.001 seconds.
If you add 5.001 every 5 seconds,
you arrive at another integer multiple of 5
after 25000s (5×5÷0.001 = 25000s = 6h56m40s).
In our Ubuntu servers, HZ=250,
so the load average is calculated every 5.004s,
which makes them match up after 6250s (5×5÷0.004 = 6250s = 1h44m10s).
And the containers make it worse
By default, Telegraf aligns its timer with the system clock, so that it collects metrics at exactly :00, :05, :10, etc. This means multiple Telegraf processes running on the same server will collect metrics at the same time; they will be in sync with each other. On this particular system there's 3 Telegraf processes running (on the host and the two LXC containers), so when metric collection happens, the number of running threads is 3 times higher.
This is probably why the problem appeared to be absent before Telegraf was installed on the other containers, and why it appears to be absent in some servers. It was actually already happening before, when it was only installed in one container, the peaks are just less noticeable in the graph (especially in lower-resolution historical data). And it happens on every server, it's just less noticeable on servers with only one Telegraf instance running, less metrics to poll, faster CPUs, etc.
I'm not sure why the problem seemed equally bad when I turned Telegraf back off on the other containers as a test. But I suspect the reason is that by now, the one instance on Leptone is doing more work than in the past. For example, it makes two or three SQL queries for GitLab CI statistics.
Solution?
For now I set round_interval=false.
This disables Telegraf's alignment to the system clock,
so that metrics collection runs every 5 seconds
from whatever time the daemon is started,
not at exactly :00, :05, etc.
Multiple Telegraf processes on the same server
will be "out of phase" and won't run in perfect sync.
The load average peaks still happen,
the metrics-collection timers still periodically match up
with the load average calculation timer,
but now the kernel will only catch one Telegraf instance at a time
and not all 3 staying in perfect sync,
so the peaks are smaller.
I'm not yet sure if this is enough.
Maybe I will end up enabling collection_jitter instead,
which adds slight randomness to each interval.
But for now this solved the issue
with anonsvn rejecting connections due to high load.