
The mystery of load average spikes

A while ago, we discovered a KDE server had strange and perfectly periodic spikes in system load average. Every 1 hour 45 minutes like clockwork, the load average would double or triple very briefly.

This caused some actual practical problems. For example, anonsvn.kde.org is configured to block new connections if the load average is too high. These spikes made anonsvn refuse connections, which more than once occurred while a release was being created, which caused missing languages in the release because the release script couldn't get translations from anonsvn...

We couldn't figure out what was causing these increases in load average. I waited for when the peak was "due" to happen, looked at top in the server, and nothing seemed out of the ordinary. There was no increased CPU that matched those peaks. We looked at disk I/O, network activity, interrupts, context switches, running processes... nothing seemed to have a correlation to the load average peaks. None of those metrics had noticeable changes that matched the 1h45m frequency.

So what could possibly be causing this? We even suspected a kernel bug or a hardware problem.

Looking at historical metrics

Many KDE servers are actually LXC containers sharing a physical server. Unlike Docker, which is designed for individual applications, these containers run a full Linux distro, init system, etc. We basically treat them like VMs with less overhead. In this case, we have a physical server called Ctenzi, which has two LXC containers: Leptone (hosting KDE Invent / GitLab) and Gallien (hosting MyKDE). We run Telegraf, the agent collecting system metrics, on both the host system and inside each container.

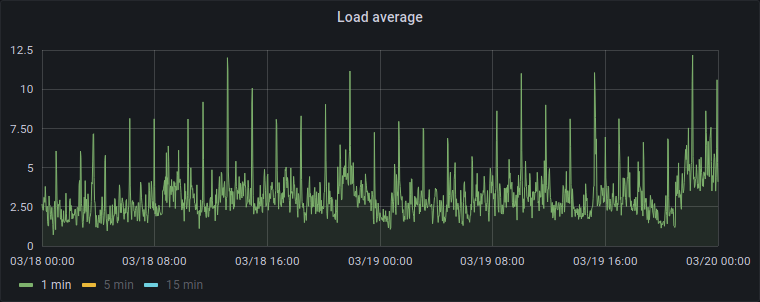
I looked at the oldest historical metrics we had for leptone to see if this problem has always been happening. It turned out that back then we weren't running Telegraf on all servers, we were installing it "as needed", so unfortunately we didn't have metrics from the very beginning of leptone's life. But I found something interesting:

  • 2020-05-09 00:30: I installed Telegraf on leptone, so that's where the graphs start for leptone.
  • 2020-05-09 17:30: I finally made the change to install Telegraf on every server (including the host ctenzi and the other container gallien).

And the metrics we have before 17:30 don't seem to show those peaks:

So... Telegraf is somehow eating CPU on the other two systems? Or they're somehow interferring with each other?

I tried stopping Telegraf on ctenzi and gallien... and it didn't seem to change anything:

[17:57] <nicolas17> the stats we have for leptone between those two times don't appear to have load peaks...
[17:57] <nicolas17> is telegraf on ctenzi/gallien causing this?!
[17:59] <nicolas17> I will do a test on the next "scheduled" peak
[17:59] <nicolas17> in about an hour
[18:21] <bcooksley> How could telegraf cause it?
[18:21] <bcooksley> That makes no sense...
[18:22] <bcooksley> Surely our other servers would be having the same issue in that case
[18:22] <bcooksley> Especially Hersili which is a near identical setup
[18:22] <bcooksley> With Deino and Telemid
[18:22] <bcooksley> It has NVMe storage and spinning rust
[18:23] <bcooksley> Only difference is 1TB vs. 512GB NVMe and maybe the CPU?
[18:23] <bcooksley> Ctenzi might be Intel vs. Hersili likely being Ryzen?
[18:26] <nicolas17> I have no idea why it could be
[18:27] <nicolas17> I will stop it on ctenzi and gallien and see if leptone gets a peak again

[19:06] <nicolas17> just stopped telegraf on ctenzi and gallien
[19:12] <nicolas17> and just got the peak in leptone's graphs
[19:12] <nicolas17> so that was not it
[19:16] <bcooksley> So it didn't happen for 17 hours, and then started happening
[19:17] <bcooksley> Yet the thing that changed at the time... Isn't the cause apparently

We did some other tests (like shutting down GitLab to see if that was the cause) and they also didn't seem to make any difference.

Other servers too

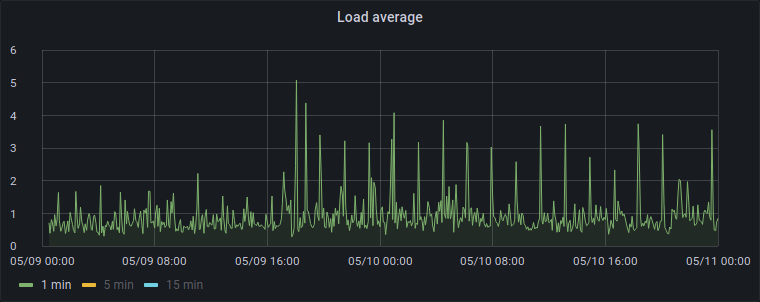
Later we discovered that other physical servers were actually having the same problem, we just hadn't noticed, in some cases because the peaks weren't as high, or because load average from normal activity was more "noisy". Load average peaks on other servers were at the exact same frequency (1h45m), but not on all servers simultaneously.

I tried to overlay lines at the right frequency on top of the graph to see if they happened when "expected" and found it was closer to 1h44m (104 minutes). This was getting more mysterious because the other affected servers had different hardware and different kernel versions.

I still suspected Telegraf could have something to do. So I did what I should have done before.

I Googled "telegraf 104 minutes".

Drifting timers

And sure enough, this did happen to other people. I found issues reported on the Telegraf repository on GitHub titled CPU load due to Telegraf agent (mentioning the 104m interval) and high load average every 1h 45m.

The GitHub issue says: Hello, I use telegraf as the collector agent for servers and since the lastest stable version, I have a strange behaviour: every 104 minutes I get a huge load and a htop show some CPU spikes with telegraf process; each server with the agent show this behaviour; server without the agent does not show this behaviour. I have noticed this difference with Shinken monitoring. How can I investigate more? Do you encounter this problem?

Following some links from there, I found a blog post from Avast where they had a similar problem, with a different metrics-collection agent (collectd), and at a different interval between spikes (~7 hours), but ultimately the same cause.

Apparently what happens is: every 5 seconds, Telegraf polls lots of system metrics simultaneously, using a dozen separate threads. Every 5.004 seconds, the kernel counts how many threads are runnable or blocked and calculates the load average based on that. And every ~104 minutes, those two timers line up exactly, before drifting again.

When the timers line up, at the exact moment the kernel calculates the load average, it sees Telegraf has a dozen running/runnable threads at the same time, and adjusts the load average upwards accordingly. The sudden increase in running threads is very brief, which is why we don't see an increase in CPU usage, but every 104 minutes, the load average calculation catches precisely at the right time.

Where does the "104 minutes" number come from? The kernel calculates load average every 5 seconds plus 1 kernel tick (Linux has an HZ setting with the tick frequency). In the Avast blog post, they mention they have load average spikes every ~7 hours. In their CentOS systems, HZ=1000, so that's every 5.001 seconds. If you add 5.001 every 5 seconds, you arrive at another integer multiple of 5 after 25000s (5×5÷0.001 = 25000s = 6h56m40s). In our Ubuntu servers, HZ=250, so the load average is calculated every 5.004s, which makes them match up after 6250s (5×5÷0.004 = 6250s = 1h44m10s).

And the containers make it worse

By default, Telegraf aligns its timer with the system clock, so that it collects metrics at exactly :00, :05, :10, etc. This means multiple Telegraf processes running on the same server will collect metrics at the same time; they will be in sync with each other. On this particular system there's 3 Telegraf processes running (on the host and the two LXC containers), so when metric collection happens, the number of running threads is 3 times higher.

This is probably why the problem appeared to be absent before Telegraf was installed on the other containers, and why it appears to be absent in some servers. It was actually already happening before, when it was only installed in one container, the peaks are just less noticeable in the graph (especially in lower-resolution historical data). And it happens on every server, it's just less noticeable on servers with only one Telegraf instance running, less metrics to poll, faster CPUs, etc.

I'm not sure why the problem seemed equally bad when I turned Telegraf back off on the other containers as a test. But I suspect the reason is that by now, the one instance on Leptone is doing more work than in the past. For example, it makes two or three SQL queries for GitLab CI statistics.

Solution?

For now I set round_interval=false. This disables Telegraf's alignment to the system clock, so that metrics collection runs every 5 seconds from whatever time the daemon is started, not at exactly :00, :05, etc. Multiple Telegraf processes on the same server will be "out of phase" and won't run in perfect sync. The load average peaks still happen, the metrics-collection timers still periodically match up with the load average calculation timer, but now the kernel will only catch one Telegraf instance at a time and not all 3 staying in perfect sync, so the peaks are smaller.

I'm not yet sure if this is enough. Maybe I will end up enabling collection_jitter instead, which adds slight randomness to each interval. But for now this solved the issue with anonsvn rejecting connections due to high load.

Decrypting iOS TLS traffic

Let's say I want to intercept an iPhone's network traffic, both the traffic from apps and from system components, in order to research the protocols (HTTP or otherwise). Most interesting traffic will be encrypted with TLS, so I'll have to decrypt it.

Proxies

A popular way to do this is to use a proxy, like mitmproxy. I run mitmproxy on my computer, set my device's proxy settings to point at it, and configure the proxy's CA certificate as trusted. Then I can see the intercepted HTTP requests in mitmproxy's UI.

One problem with this approach is that any application using certificate pinning for security reasons won't accept the proxy's CA certificate, and will reject connections. On a jailbroken device, there are tweaks I can inject into applications to disable pinning, but there are many ways to implement cert pinning and no tweak seems to reliably neutralize them all.

Another problem is that tools like mitmproxy only support HTTP, not other protocols that may also be using TLS. This is annoying since, as I'll show in later blog posts, I'm especially interested in looking at the push notification service, which uses a proprietary "APNS" protocol with TLS encryption. There is a man-in-the-middle proxy for APNS called pushproxy, but it doesn't work for current iOS versions (and I would still need to deal with the certificate pinning issue).

Wireshark

Another option is to passively capture the network traffic and analyze it with Wireshark, which can decrypt TLS if we give it the session keys.

To intercept the raw network traffic, I can run a software Wi-Fi access point on my computer, make my phone connect to it, and run Wireshark on the Wi-Fi interface. On a Mac there are other ways to get an iOS packet trace.

But how do we get TLS session keys to decrypt the traffic? We'll need a jailbroken iPhone, but that's something we would have needed to bypass certificate pinning anyway, if we used the MitM proxy method. (Maybe it can be done without jailbreaking for App Store apps, but for system software there's no way around it.)

Getting keys with Frida

I found a blog post by Andy Davies about Capturing and Decrypting HTTPS Traffic From iOS Apps Using Frida. "Frida injects a JavaScript VM into applications and we can write JS code that runs in that VM and can inspect memory and processes, intercept functions, create our own native functions etc."

BoringSSL (based on OpenSSL, used by Apple on iOS nowadays) already has code to dump session keys in the format expected by Wireshark. In Andy's blog post, he injects a Frida script into the application that sets the BoringSSL "keylog callback" to a custom function, which then outputs the keys to a file.

This Frida script uses a single hardcoded offset to find the keylog callback function pointer inside the SSL_CTX structure, which means it will only work on certain iOS versions. The SSL_CTX_set_keylog_callback function is how you'd usually set it, but it's not present in any Apple libboringssl.dylib version I looked at.

I haven't tried Frida yet (although it looks useful and I really should try it). But it seems a disadvantage here is that you have to inject Frida into the specific process whose traffic you want to watch, and it wouldn't be easy to inject it into everything.

Getting keys with a tweak

As an alternative, I wrote a MobileSubstrate tweak to get TLS session keys from iOS processes. You can get it from the sslkeylog GitLab repository, or my Cydia repo at
https://data.nicolas17.xyz/cydia/.

It has several advantages over the Frida script:

  • It's injected into every process in the system, instead of only the one process where you attach Frida.
  • It works on all 64-bit iOS versions between 12.0 and 14.4, by including a list of offsets for the BoringSSL keylog callback for all those versions.
  • It supports not only BoringSSL but also the older "SecureTransport" Apple framework. Notably, the push notification daemon still uses SecureTransport in iOS 12.

My first version just dumped the keys to the syslog, but it was annoying to parse them out of the syslog messages. Then I added a command-line tool to get the keys more easily. The way it works is that the injected tweak extracts the keys, and sends them to an sslkeylogd daemon over XPC. At any time you can run the sslkeylog command line tool (eg. over ssh), and it will connect to the daemon and start printing out the keys that the tweak extracts.

You can either get the keys in real time over ssh, or redirect them into a file and copy the file off the device later.

Tutorial

Here is how to capture the iPhone's network traffic on Linux and decrypt the network traffic. Requires a Linux computer with Wi-Fi (I use an external USB dongle) and a jailbroken iPhone. (Of course this should work on iPad and iPod touch too, I just say "iPhone" for simplicity).

First, install sslkeylog on iOS. You can add https://data.nicolas17.xyz/cydia/ as a Cydia repository source, or get the .deb file from the Releases page. Make sure the mobilesubstrate dependency gets installed too.

If you want to get keys from system daemons, you should now reboot the iPhone. This is the best way to ensure every system daemon restarts and loads the tweak. But it's not necessary if you're only interested in a particular app.

As a test, you can now connect to the phone via SSH and try dumping keys. If you used checkra1n to jailbreak, you may have to proxy it over USB, using iproxy or inetcat from the libimobiledevice package.

ssh -o 'ProxyCommand=inetcat 44' mobile@iPhone sslkeylog

It will print "subscribed" at first. Make some TLS traffic (eg. open Safari and load a website). You should see TLS session keys like this:

CLIENT_HANDSHAKE_TRAFFIC_SECRET 99cf2fabcc272914ae2c93a3603864a505e76092a6511176d7ae2f7f9c6058f7 37bed74ebb5c40dd525ae480adfe02d23e3d0a4c9083d8767f35cbbf23852da4
SERVER_HANDSHAKE_TRAFFIC_SECRET 99cf2fabcc272914ae2c93a3603864a505e76092a6511176d7ae2f7f9c6058f7 1cd72af732da492b02568ae75e9d67ed394d50061fe6a56dfe5d847633e6a549
CLIENT_TRAFFIC_SECRET_0 99cf2fabcc272914ae2c93a3603864a505e76092a6511176d7ae2f7f9c6058f7 63164e02b24232e34a5cf50d7f3ee92e82700393f4a838e8b561770dc835990d
SERVER_TRAFFIC_SECRET_0 99cf2fabcc272914ae2c93a3603864a505e76092a6511176d7ae2f7f9c6058f7 452f5a90a24b5a857bbe38ab682790e379cfd6fcd1fcf599837662e3f3ffe798
EXPORTER_SECRET 99cf2fabcc272914ae2c93a3603864a505e76092a6511176d7ae2f7f9c6058f7 845b6799e8dde45012a69d6805bf950503d17a5f5ce64d77b918b1d9aa5e2eaa
CLIENT_RANDOM 6088F6D60B7034F82E9D20CD833D2DFC2F34A7A91D618348BE1C07F668B4DB4F A2F9AF6082BB09FD37C504845F73094966B44ACED72A96D2C3BD5FA2CB475A4F59031298A9BD517344ECDD0B73764786

Simply use Ctrl-C to stop it.

Let's do some actual packet capturing now. We will run a Wi-Fi access point on the Linux computer and bridge it to the Internet connection, so we can then let the iPhone connect to it and capture packets from the Wi-Fi interface.

On your Linux system, install hostapd. Create a config file hostapd.conf:

# the interface used by the AP, replace as needed
interface=wlan0
bridge=br0

# the name of the AP
ssid=iPhoneCapture
# Driver interface type (hostap/wired/none/nl80211/bsd)
driver=nl80211
# Country code (ISO/IEC 3166-1)
country_code=AR

# 1=wpa, 2=wep, 3=both
auth_algs=1
# 1=WPA, 2=WPA2, 3=both
wpa=2

# Set of accepted cipher suites; disabling insecure TKIP
wpa_pairwise=CCMP
# Set of accepted key management algorithms
wpa_key_mgmt=WPA-PSK
# Network password
wpa_passphrase=helloworld

Ensure IP forwarding is enabled, and that the firewall allows forwarding. Forgetting this step caused me big troubleshooting headaches...

sudo sysctl net.ipv4.ip_forward=1
sudo iptables -P FORWARD ACCEPT

Create the network bridge, and add your normal Internet connection network interface to it (replace enp1s0 if needed):

sudo ip link add name br0 type bridge
sudo ip link set br0 up
sudo ip link set enp1s0 master br0

Finally, start the access point:

sudo hostapd hostapd.conf

It will automatically add the Wi-Fi network interface to the bridge too. When hostapd prints AP-ENABLED, your iPhone should be able to see the network in Wi-Fi settings; but it's better to start capturing packets before connecting the phone to the network to ensure you get the traffic of all connections from the beginning, so don't connect it yet.

To start dumping TLS keys, run the ssh command mentioned above, but sending the output to a file:

ssh -o 'ProxyCommand=inetcat 44' mobile@iPhone sslkeylog | tee /tmp/ssl.log

Now open Wireshark. Go to Edit → Preferences → Protocols → TLS (may be called "SSL" in older Wireshark versions). Set the "(Pre)-Master-Secret log filename" to /tmp/ssl.log and save preferences.

Wireshark TLS preferences

Make Wireshark start capturing from the Wi-Fi interface, and then finally connect the iPhone to the AP. You should see keys start appearing in your ssh sskleylog | tee terminal session, and all new TLS connections in Wireshark should be getting decrypted.

Wireshark showing TLS-encrypted HTTP2 requests from iOS

When you're done, you can kill hostapd with Ctrl-C, and you can delete the bridge with sudo ip link delete br0. Killing hostapd sometimes makes the Internet connection on my computer stop working (I haven't figured out the exact conditions), deleting the bridge fixes that.

Offsite backups for KDE servers

Most of KDE's servers are hosted in Hetzner in Germany. We also have a storage box there where we store backups for most servers (including those outside Hetzner).

When the OVH datacenter fire happened, everyone who managed servers but didn't use OVH still got worried about their own data and backups. Including the KDE Sysadmin team; we wondered if KDE's data would be protected if a similar disaster happened at Hetzner.

We can know in which specific datacenter a server is, and even choose the DC when ordering a new server. However, it turns out we can't know or choose the datacenter for storage boxes. I asked Hetzner support and they said they don't give that information, and "that may even change" (I guess they reserve the right to transfer the storage to another DC according to internal needs).

This means it's possible that one of our servers is in the same datacenter as the backup storage, and if there is a catastrophic accident in the datacenter, as unlikely as that may be, we could lose that server and its backups.

Well, last week our storage box ran out of disk space. We could have quickly upgraded to a larger storage "in place", but we decided to take the opportunity to finally fix this point of failure.

During the weekend, we ordered a new (larger) storage box in Hetzner's separate region in Finland, transferred all 2TB(!) of data to it, and changed the scripts on the servers to store new backups there. Our backups are now ~1500km away from the production servers, and our data should be safe even if a major incident affects a whole datacenter in Germany \o/

Even if we have backups of the data, we would still have extended downtime as we set up the new servers. Reinstalling a server still involves an annoying number of manual and vaguely documented steps. Improving that is a slow ongoing task...

First post

Okay, after years of saying "I should make a blog", I finally made a blog.

You'll hopefully see KDE stuff, sysadmin stuff, and Apple reverse-engineering stuff here soon. But I will probably keep the Apple stuff out of Planet KDE 😉